
You probably know the feeling. A technician calls from a job and says, “I've got most of it, but I'm missing one valve, one fitting, or the right igniter.” Now the job slows down, the customer waits, and someone makes a supplier run that wasn't in the day's plan.
That problem usually gets blamed on the tech, the supplier, or bad luck. Most of the time, it's a forecasting problem. Not a big-company, boardroom kind of forecasting problem. A small trade business version of it. You need a better way to decide what belongs on the shelf, what belongs on each truck, and what shouldn't be ordered again until there's a real reason.
The hard part is that HVAC and plumbing parts demand is messy. Emergency calls distort usage. One technician burns through common fittings while another hoards stock on the van. Some parts move with seasons. Others move when older equipment starts failing in clusters. If you use simple averages, your numbers lie to you.
Good tools for forecasting parts demand for HVAC plumbing business don't need perfect data. They need disciplined data, practical review, and a method that fits how your company operates.
Table of Contents
- Why Guessing Parts Demand Is Costing Your Business Money
- The Foundation What Data You Actually Need to Collect
- Forecasting Methods Explained From Simple to Automated
- Choosing the Right Category of Forecasting Tool
- Connecting Forecasts to Your Inventory and Job Schedule
- Measuring Success and Avoiding Common Pitfalls
Why Guessing Parts Demand Is Costing Your Business Money
A missed part doesn't just delay one job. It knocks the day sideways. Dispatch reshuffles appointments, a technician loses productive time, the customer starts wondering if your company is organized, and the office gets dragged into fixing a problem that started in inventory.
That's why guessing is expensive even when the dollar loss isn't obvious on one invoice. This cost shows up in wasted labor, repeat trips, rushed buying, dead stock on shelves, and trucks carrying parts nobody touches for months.

What bad forecasting looks like in the field
In most trade businesses, poor forecasting shows up in a few repeat patterns:
- The supplier run problem: A tech starts a repair with the wrong mix of truck stock and loses time hunting down a common part.
- The warehouse graveyard problem: Shelves fill up with specialty items bought for one project or one brand that rarely comes back.
- The seasonal scramble problem: Heat, cold, storm damage, and peak service periods hit faster than your reorder habits can react.
- The emergency-job distortion problem: A run of urgent calls tricks the business into thinking certain usage is normal every week.
The parts you remember running out of are only half the issue. The parts you keep overbuying quietly drain cash for longer.
This is happening in a market where inventory mistakes carry real weight. The U.S. plumbing and heating equipment wholesaling market is projected to reach $132.8 billion by 2026, while 2026 revenue was also projected to contract by 2.5% because of volatility and uncertainty, according to IBISWorld's plumbing and heating supplies wholesaling outlook.
Why small businesses need this just as much as larger ones
A small shop can't hide inventory mistakes. If you've got a few trucks and a modest warehouse, every wrong order ties up working cash. Every stockout is personal because the owner usually feels it in scheduling, customer calls, and payroll pressure that same week.
Forecasting doesn't mean building a complicated data science department. It means replacing “we usually order this much” with something better:
- Known usage patterns
- Clean categories
- Seasonal awareness
- Lead-time planning
- Regular review of what the numbers missed
When owners say they want better inventory control, what they usually mean is simpler. They want fewer surprises. That's exactly what forecasting is for.
The Foundation What Data You Actually Need to Collect
Most inventory systems fail before the forecast starts. The issue isn't the software. The issue is weak inputs.
If your records only show what you purchased, not what was used, the forecast will be wrong. If your numbers mix maintenance work, emergency repairs, quoted projects, and technician truck restocks into one pile, the forecast will be noisy. If stockouts aren't recorded, your history tells you demand was low when in reality you had nothing available to sell or install.
A common problem in this trade is that historical data is sparse or biased by technician habits, emergency jobs, stockouts, and truck depletion. That's why generic advice about “just use past sales” often fails, as noted in this practical discussion of HVAC inventory management and data quality issues.
Start with usage, not just purchasing
The best starting point is part usage tied to work performed. That means you want to know what left the warehouse or truck and why.
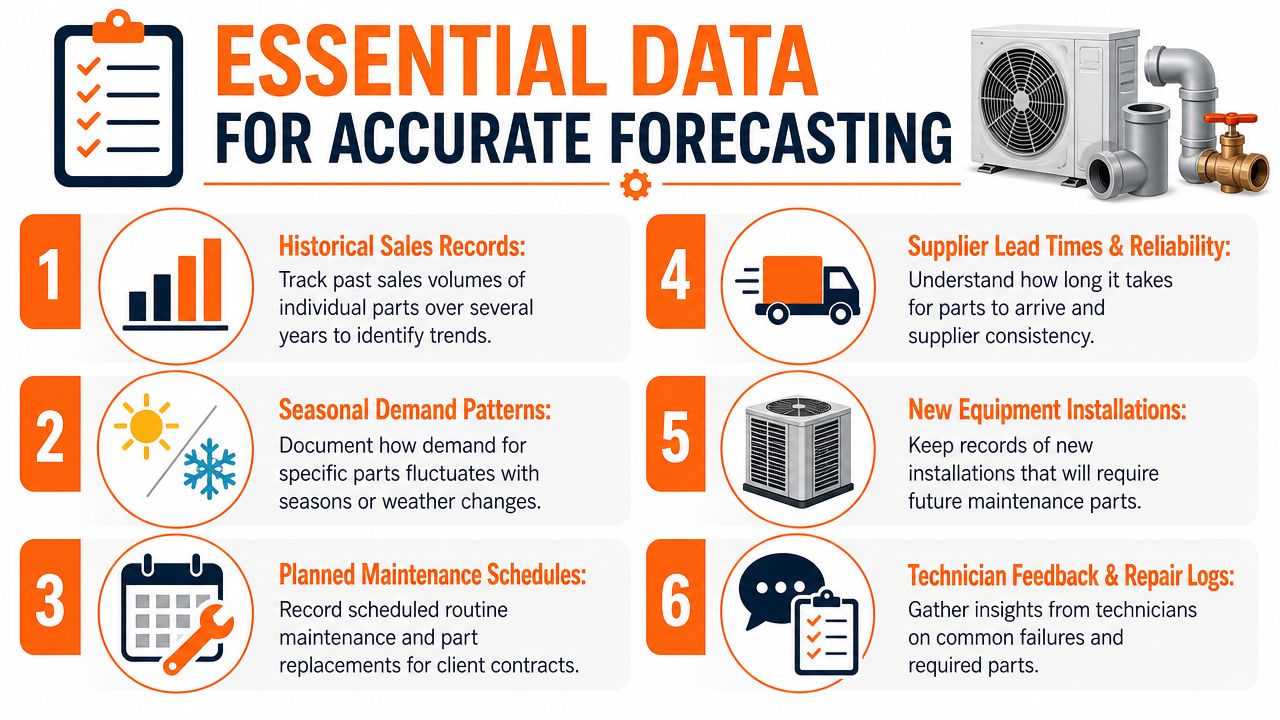
Collect these records first:
- Part number and description: Keep naming consistent. If the same item appears under three names, your history fractures.
- Date used: Weekly patterns matter more than vague monthly memory.
- Job type: Separate emergency repair, planned maintenance, warranty, install, and quoted project work.
- Technician or truck: This helps expose hoarding, under-reporting, and route-specific demand.
- Customer equipment context: Brand, model family, age, or system type can explain repeat failures better than a raw part count.
- Stockout note: Mark where demand existed but inventory didn't.
Correct the three biggest data distortions
Most small companies don't need perfect records. They need to stop letting bad records mislead them.
Here are the three biggest distortions to clean up:
Emergency spikes
A burst of no-heat or leak calls can make a part look like a steady mover. Tag these jobs so they don't become your normal baseline.One-off projects
Large install or retrofit work can swamp service demand. Keep project consumption in its own bucket.Truck stock drift
Techs often borrow, swap, stash, or forget to report small items. If you don't audit van stock, your history becomes fiction.
Practical rule: If a part leaves a truck and never hits a work order, your forecast is learning from a blind spot.
Where to pull the data from
You don't need an enterprise stack to start. Pull from the systems you already trust most:
- Field service software: Work orders, job tags, and technician assignments
- Accounting records: Vendor purchases and cost history
- Invoices: Installed parts by customer and service type
- Warehouse logs: Receipts, transfers, and adjustments
- Technician feedback: Common failures and parts they repeatedly chase
If your records are still messy, tighten the bookkeeping around inventory and job costs first. This guide on bookkeeping for plumbing businesses is a useful place to clean up the financial side before you automate the forecast.
Forecasting Methods Explained From Simple to Automated
You don't need to become a statistician to use better forecasting. You do need to know what the common methods are doing, where they help, and where they break.
A lot of owners start with a spreadsheet and a rough average. That's fine for a first pass. It stops being fine when seasonality, emergency jobs, and uneven part movement start warping your reorder decisions.
The simplest option that still works
A simple moving average looks at past usage over a selected period and averages it out. It's easy to build, easy to explain, and easy to misuse.
Use it for parts that move steadily and predictably. Don't trust it for parts tied to weather swings, seasonal service, or sudden breakdown clusters. It smooths the bumps, but sometimes the bumps are the signal.
A better step up is weighted moving average with exponential smoothing, often shortened to WMA-ES. This method gives more importance to recent usage instead of treating old demand and current demand as equally relevant.
For high-turnover items, WMA-ES can reach a 90% service level, and case studies show it can outperform simple averages by 12-15% for seasonal parts when recent periods are weighted more heavily, such as a 0.3-0.5 factor, with recalibration based on forecast error. That benchmark appears in the verified data you provided for this article.
Why weighting recent history matters
If you service cooling heavily in one stretch and heating in another, a flat average blurs what's happening. Weighted models react faster.
That makes WMA-ES useful for items like:
- Frequently used fittings and seals
- Common maintenance parts
- Seasonal replacement items
- Truck stock that turns regularly
It's less useful for weird, low-frequency items. Proprietary cartridges, unusual boards, oddball repair kits, and parts tied to rare failures often need human review alongside the math.
When time-series models earn their keep
As your data improves, time-series models become more useful. These models look for patterns across time, not just totals.
One major example is Auto-ARIMA. In practice, that means the system tries to identify trend and seasonality structure from your historical demand and fit a model without you manually tuning every variable.
According to the verified data for this article, Auto-ARIMA can reduce inventory error rates by 15-20% compared with traditional moving averages. It's especially helpful when you've got seasonal parts demand and enough clean history to model recurring patterns.
If your forecast still treats July and January as the same for HVAC parts, the method is too crude for the job.
Forecasting methods at a glance
| Method | How It Works | Best For | Downside |
|---|---|---|---|
| Simple Moving Average | Averages usage across a chosen past period | Stable, repetitive parts | Slow to react to shifts |
| Weighted Moving Average with Exponential Smoothing | Gives more weight to recent periods and smooths noise | High-turnover seasonal parts | Can still misread low-frequency or lumpy demand |
| Regression | Connects demand to outside drivers such as weather or workload | Parts influenced by external conditions | Needs cleaner inputs and more setup |
| Auto-ARIMA | Models time-based demand patterns automatically | Seasonal service parts with usable history | Weak if the data is messy or too sparse |
| Hybrid review | Combines model output with dispatcher, warehouse, or service manager judgment | Specialty parts and exceptions | Depends on disciplined human review |
What modern software is doing under the hood
A lot of newer inventory and supply tools don't rely on one forecasting method. They run several and let the system choose or compare performance.
That matters because HVAC and plumbing demand isn't uniform. Some parts follow seasonal patterns. Some react to recent breakdown trends. Some are affected by holidays, weather, lead times, or local project activity.
When software vendors talk about “AI forecasting,” ask one direct question: what method is it using for your part categories? If they can't explain that in plain language, you're buying a black box.
Choosing the Right Category of Forecasting Tool
The best tool is the one your team will use, maintain, and trust. Plenty of businesses buy more system than they need. Just as many stay stuck in spreadsheets long after the spreadsheet has become the bottleneck.
There are four broad categories worth looking at.
Spreadsheets for owner-led control
Many small shops often begin here. A spreadsheet offers more capabilities than often realized if the data is clean and someone owns the file.
Where it works well
- You have a limited number of core SKUs
- One person handles ordering
- Demand is still manageable by category
- You want to test a process before buying software
Where it fails
- Truck stock isn't updated reliably
- Multiple people edit the file
- You need location-level visibility
- Seasonal and job-type effects are getting harder to separate
A spreadsheet is useful as a control tool. It's weak as an operating system.
Inventory software with basic forecasting
This category gives you part tracking, reorder points, purchase orders, and some level of forecasting or replenishment support. For many small to midsize firms, this is the practical middle ground.
The upside is structure. You get cleaner receiving, better visibility across warehouse stock, and fewer manual reorder mistakes. The limitation is that some products still use basic logic dressed up as advanced planning.
Field service management platforms
If your operation already runs through one main field service system, this category can be attractive because inventory ties directly to jobs, technicians, invoices, and dispatch.
That connection matters. The more tightly your work orders and inventory activity connect, the easier it is to capture real usage instead of guessing from purchases later. If you're comparing systems in this space, this roundup of apps for plumbing businesses helps frame what belongs in an integrated operating stack.
Demand planning and enterprise platforms
This is the top end. These systems are stronger when you have larger stock pools, more locations, more categories, and more volatility in demand.
Modern enterprise tools have moved well beyond simple historical averaging. Microsoft Dynamics 365 Supply Chain Management, for example, includes four forecasting algorithms: auto-ARIMA, ETS, Prophet, and XGBoost, as documented in Microsoft's forecast algorithm types overview. That matters because different parts behave differently, and one method won't fit everything.
Don't buy enterprise forecasting because it sounds advanced. Buy it only if your business complexity is outrunning your current system.
A practical way to choose
Use these questions instead of vendor marketing claims:
| Tool category | Best fit | Strength | Limitation |
|---|---|---|---|
| Spreadsheet | Small operation with few movers | Cheap and flexible | Manual and fragile |
| Inventory software | Growing service business | Better stock control and purchasing | Forecasting may still be basic |
| FSM platform | Service-led company with mobile teams | Ties jobs, parts, and techs together | Inventory depth varies by product |
| Demand planning platform | Larger, multi-location business | Stronger forecasting logic and segmentation | More setup, more discipline required |
If you've got inconsistent part naming, weak truck controls, and no regular counts, buying an advanced forecasting tool won't fix the root problem. Clean process first. Then upgrade the system.
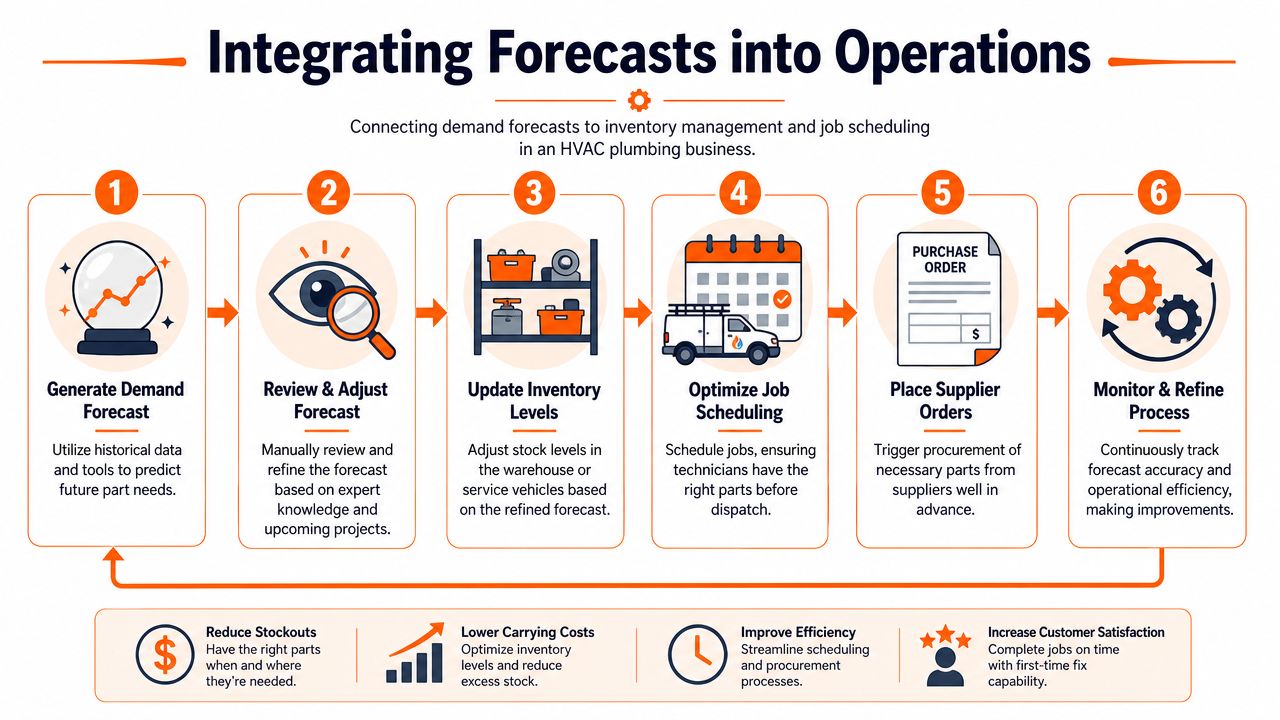
Connecting Forecasts to Your Inventory and Job Schedule
A forecast that lives in a report is wasted effort. The point is to change what gets ordered, where it gets stocked, and how jobs get prepared.
The simplest win is using your forecast to split stock into three places: warehouse stock, truck stock, and special-order stock. Too many businesses blur those together. Then they wonder why vans are overloaded and the warehouse still runs short on basic items.
Use the forecast to set stock by location
Start with your fastest movers. Those belong where the work happens most often. If a part is used repeatedly on service calls, it probably belongs on trucks in controlled minimums. If it supports a wider range of jobs but doesn't need to travel, keep it in the warehouse. If it's rare or equipment-specific, treat it as special-order unless a service pattern proves otherwise.
This isn't about one perfect min-max number. It's about matching stock placement to actual use.
A practical flow looks like this:
- Review expected demand by category
- Check supplier lead times
- Assign stock location
- Set reorder triggers
- Prep parts against upcoming jobs
- Audit misses and adjustments weekly
Tie inventory to the work already booked
The best forecasts don't only look backward. They also look at the jobs already scheduled.
If you've got maintenance calls booked next week, the likely parts usage should influence what gets staged now. If several repairs use the same common component, your buyer should see that before the schedule turns into a shortage.
This is one place where stronger models help. According to the verified data for this article, Auto-ARIMA can reduce inventory error rates by 15-20% versus moving averages. The same verified data also states that combining advanced models with demand-sensing IoT inputs can bring forecast accuracy to under 12% MAPE, while standalone statistical models average 18-22% error.
That sounds technical, but the operational lesson is simple. The more current signals you feed the system, the better the stocking decision becomes.
Build one routine your team can keep
The process doesn't need to be complicated. It needs to happen every week.
Use one recurring routine:
- Warehouse review: Check forecasted movers, shortages, and aged stock
- Truck review: Compare actual usage against assigned van minimums
- Schedule review: Pull forward parts needed for booked work
- Buyer review: Confirm what should be ordered now versus watched
- Exception review: Identify parts distorted by emergencies or one-off jobs
If your financial records and purchasing records don't line up cleanly with job activity, tighten that before expanding automation. This overview of accounting for plumbing businesses is a practical reference for getting the numbers under control.
Measuring Success and Avoiding Common Pitfalls
You don't need a stack of complicated metrics to know whether forecasting is helping. You need a short list that connects to pain points. Stockouts. excess stock. rushed buying. technician downtime. parts sitting in the wrong place.
The KPIs that matter most
Track a small set of operational measures and review them consistently.
- Stockout frequency: How often a needed part wasn't available when the job required it
- Dead stock or slow-moving stock: Parts that haven't moved in a long time and keep tying up cash
- Forecast error by category: Where the model or spreadsheet keeps missing, especially by part family or job type
- Emergency purchase count: How often the team had to buy outside the normal replenishment process
None of these need to start fancy. A simple monthly review is enough if it's honest.
The mistakes that keep hurting good businesses
Forecasting usually fails for process reasons, not math reasons.
Common failures include:
- Trusting purchases instead of usage: Buying history doesn't always reflect field demand.
- Mixing unlike demand together: Maintenance, install, warranty, and emergency work shouldn't live in one undifferentiated average.
- Ignoring lumpy demand: Specialized parts often move in bursts, not steady lines.
- Skipping review after stockouts: If a part wasn't available, your system recorded less demand than existed.
- Letting technicians bypass the process: Unlogged van usage ruins the data.
A forecast is only useful if someone challenges it before the order goes out.
A simple starting checklist
If you want a practical way forward, start here:
- Pick one category first: Don't boil the ocean. Start with a manageable group of common service parts.
- Clean part names: Remove duplicates and inconsistent labels.
- Tag work by type: Separate service, maintenance, install, and emergency usage.
- Audit truck stock regularly: Even simple counts beat assumptions.
- Use a method that matches the category: Weighted moving average for common movers, manual review for oddballs.
- Review misses every month: Ask why the forecast was wrong, not just whether it was wrong.
Small businesses don't need perfect forecasting. They need repeatable forecasting. If the process helps you buy fewer wrong parts, reduce supplier runs, and raise part availability on real jobs, it's working.
GrowTradie helps trade businesses stay visible without adding more work to the week. If you want a simple way to keep your business active online while you focus on operations, take a look at GrowTradie. It's built for tradies who want consistent, professional content without having to write, design, and post it all themselves.